
A home battery can start charging at 10kW and then settle at 6–7kW after only 20 or 30 minutes. That change is easy to describe and surprisingly difficult to diagnose.
The lower power may come from the battery, the BMS, the inverter, the household load, the grid-import setting or the way the monitoring platform reports data. It does not automatically mean the battery is faulty.
One customer scenario involved a 44.8kWh battery charging from the grid. The system initially showed about 10kW, then dropped to roughly 6–7kW after 20–30 minutes. The available information did not establish one confirmed fault, so this article treats it as a diagnostic scenario rather than proof of a product defect.
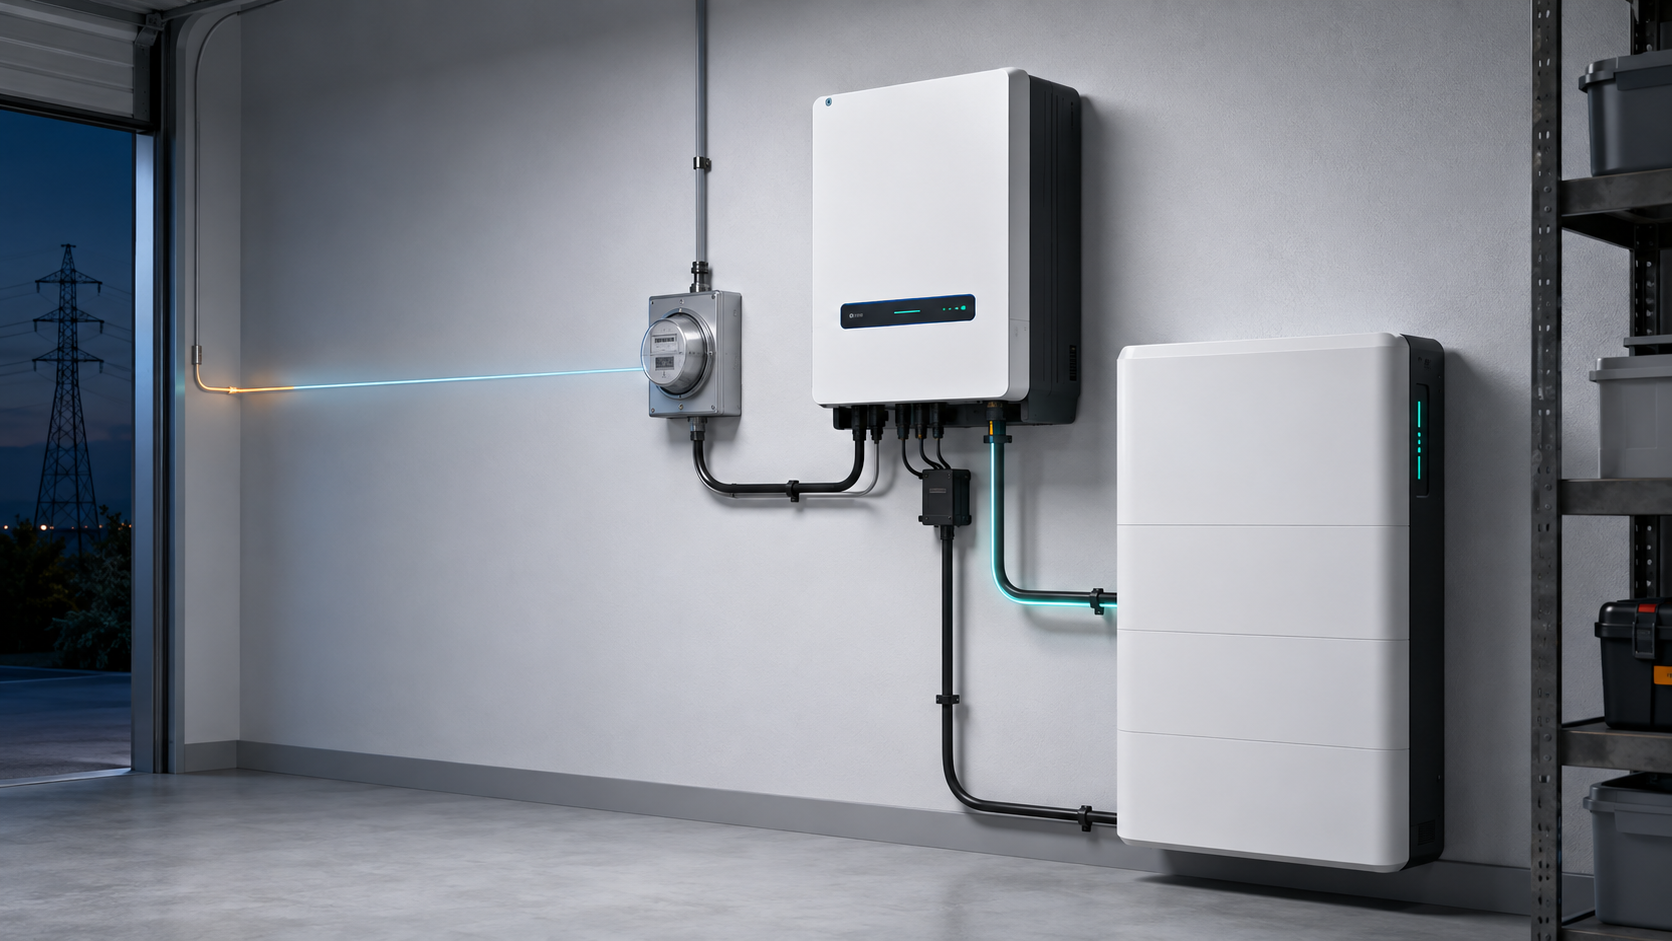
This guide explains how to separate normal charging behavior from power derating and how to collect the data needed for a proper diagnosis.
Start with the power path, not the battery label
In a grid-charging system, energy usually follows this path:
Utility grid → AC input → hybrid inverter or charger → DC battery bus → battery cells
At the same time, the home is drawing power from the same grid connection.
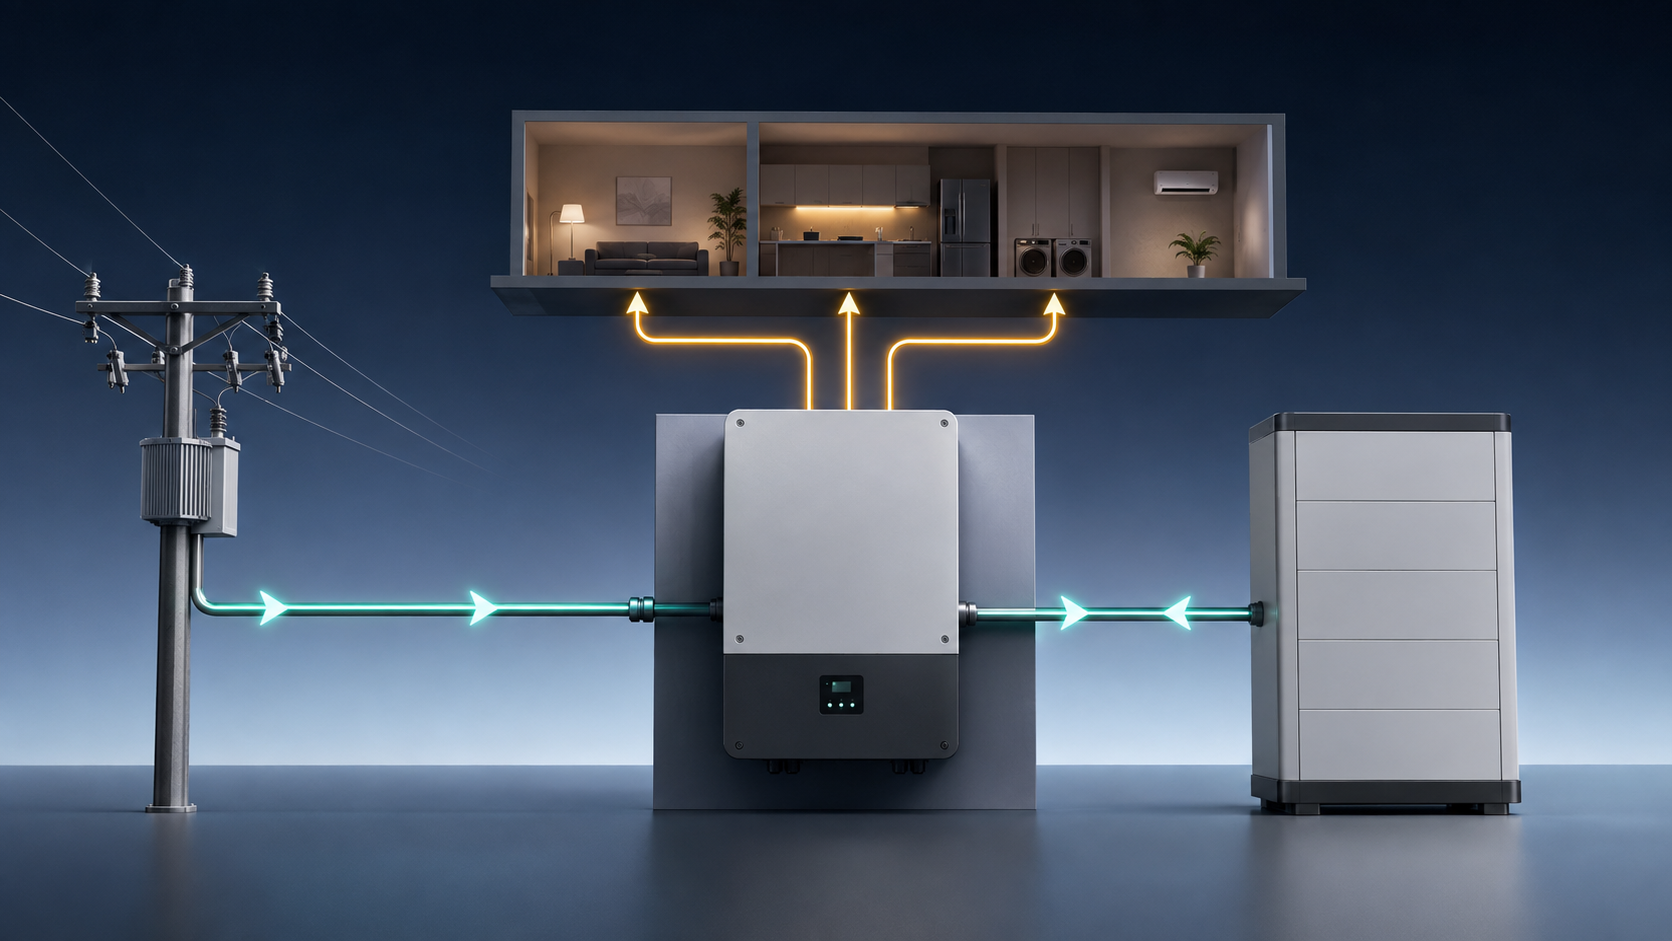
A simple system-level relationship is:
Grid import power ≈ household load + battery charging power
Pcharge = min(inverter limit, BMS charge-current limit, temperature limit, SOC/CC-CV limit, grid-import limit, available source power)
This is why a battery may be advertised as capable of 10kW charging without accepting 10kW at every moment. A rated value is a boundary under specified conditions, not a promise that the system will hold that value through the entire charging cycle.
What the 44.8kWh example tells us
| Charging state | Power | Approximate C-rate* |
|---|---|---|
| Initial charging | 10kW | 0.223C |
| Later charging | 6.5kW | 0.145C |
| Change | -3.5kW | About 35% lower |
*This assumes the displayed power is battery-side power and that 44.8kWh is the relevant capacity. If the number comes from the AC meter, the DC battery power will be different because of conversion losses.
The first conclusion is not “the cells are bad.” The system moved from roughly 0.22C to 0.15C. The next question is which control layer requested the lower current.
First check: are you comparing the same measurement point?
A customer may see several different power values at the same time:
- Grid-meter import power
- Inverter AC input power
- Inverter DC output power
- Battery BMS charge power
- Cloud-app power estimated from periodic data
These values are related, but they are not identical. If a home is using 3.5kW and the grid meter shows 10kW of import, the battery may be receiving approximately 6.5kW before conversion losses. A customer looking only at the grid meter could mistake total import power for battery charging power.
Some energy apps upload data at intervals or smooth short peaks rather than recording every instant of the power curve. Treat an app screenshot as a clue until it is compared with local meter, inverter and BMS data captured at the same time.
Cause 1: temperature creates a delayed power derating response
“Temperature” hides two different questions: is the battery too cold or too hot, and is the inverter or charger getting too hot? The battery and the inverter can reach their limits at different times.
Battery temperature
Lithium battery charging is limited by the cell manufacturer, the battery pack design and the BMS settings. At low temperature, internal resistance rises and charge acceptance can fall. At high temperature, the BMS may reduce current to keep the cells within their safe operating window.
The U.S. Department of Energy notes that stationary lithium-ion systems are generally designed around 20°C to 25°C, while NREL describes low temperature as a condition that can significantly reduce power performance and available capacity. These are system-level reference points, not universal charge limits for every battery. The actual charge-current window still comes from the cell, pack and BMS documentation.
Record the highest and lowest cell temperature, battery-module temperature, inverter or charger internal temperature, and ambient temperature near the equipment. Room temperature alone is not enough.
Inverter temperature
The power converter can derate even when the battery cells are within range. Inverter manuals normally publish continuous-power data against ambient temperature, ventilation and installation conditions. Use the selected inverter’s own curve: record its internal temperature, alarm state and active AC-charge limit, then compare them with that manual.
How much temperature derating is possible?
The size of the effect is design-specific. A DOE stationary-storage review describes heat generation as broadly flat through about 20% to 80% SOC, then increasing near the upper SOC region; it also notes that charging efficiency can fall significantly near 100% SOC because of balancing. This is a useful boundary for interpretation, not a universal derating percentage.
Cause 2: SOC moves the battery into the CC-CV charging stage
Most lithium battery charging profiles have a high-current phase followed by a constant-voltage phase. During constant-current charging, the charger tries to hold the requested current while battery voltage rises. Once the charge-voltage target is reached, the charger holds voltage and current begins to taper.
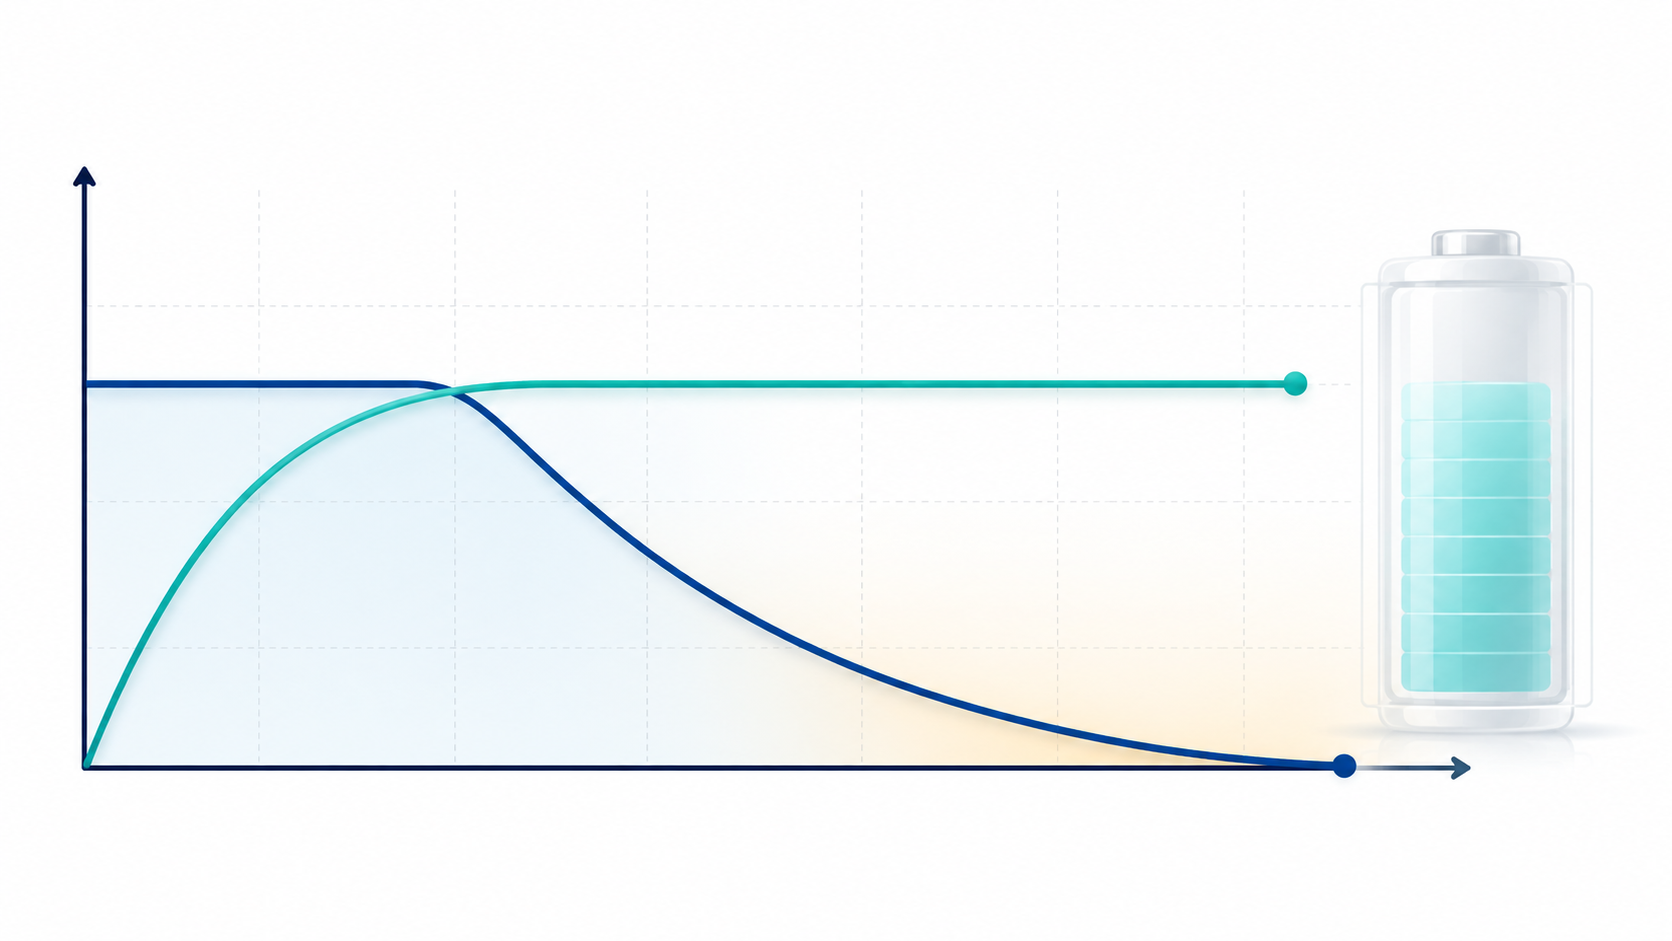
This is the standard constant-current/constant-voltage pattern used in lithium-ion charging research. One recent charging study simulated rates from 0.5C to 4C, which illustrates why a C-rate must be interpreted with the cell design, temperature and control strategy rather than treated as a universal setting.
Why high SOC matters
- Below the upper SOC range, the battery may accept near-rated power.
- Above roughly 80%, some products begin to reduce the charge rate.
- Near 95–100%, current can taper sharply.
- At 99% SOC, low charging power may be part of top-of-charge control or balancing.
These are operating patterns, not universal thresholds. If the battery starts at 75% SOC and reaches 98% around the time power falls, a normal CC-CV explanation is plausible. If the battery is still at 55% SOC when power drops sharply, SOC alone is a weaker explanation and the investigation should move toward temperature, BMS limits, EMS settings or the inverter.
Cause 3: one cell reaches its limit before the others
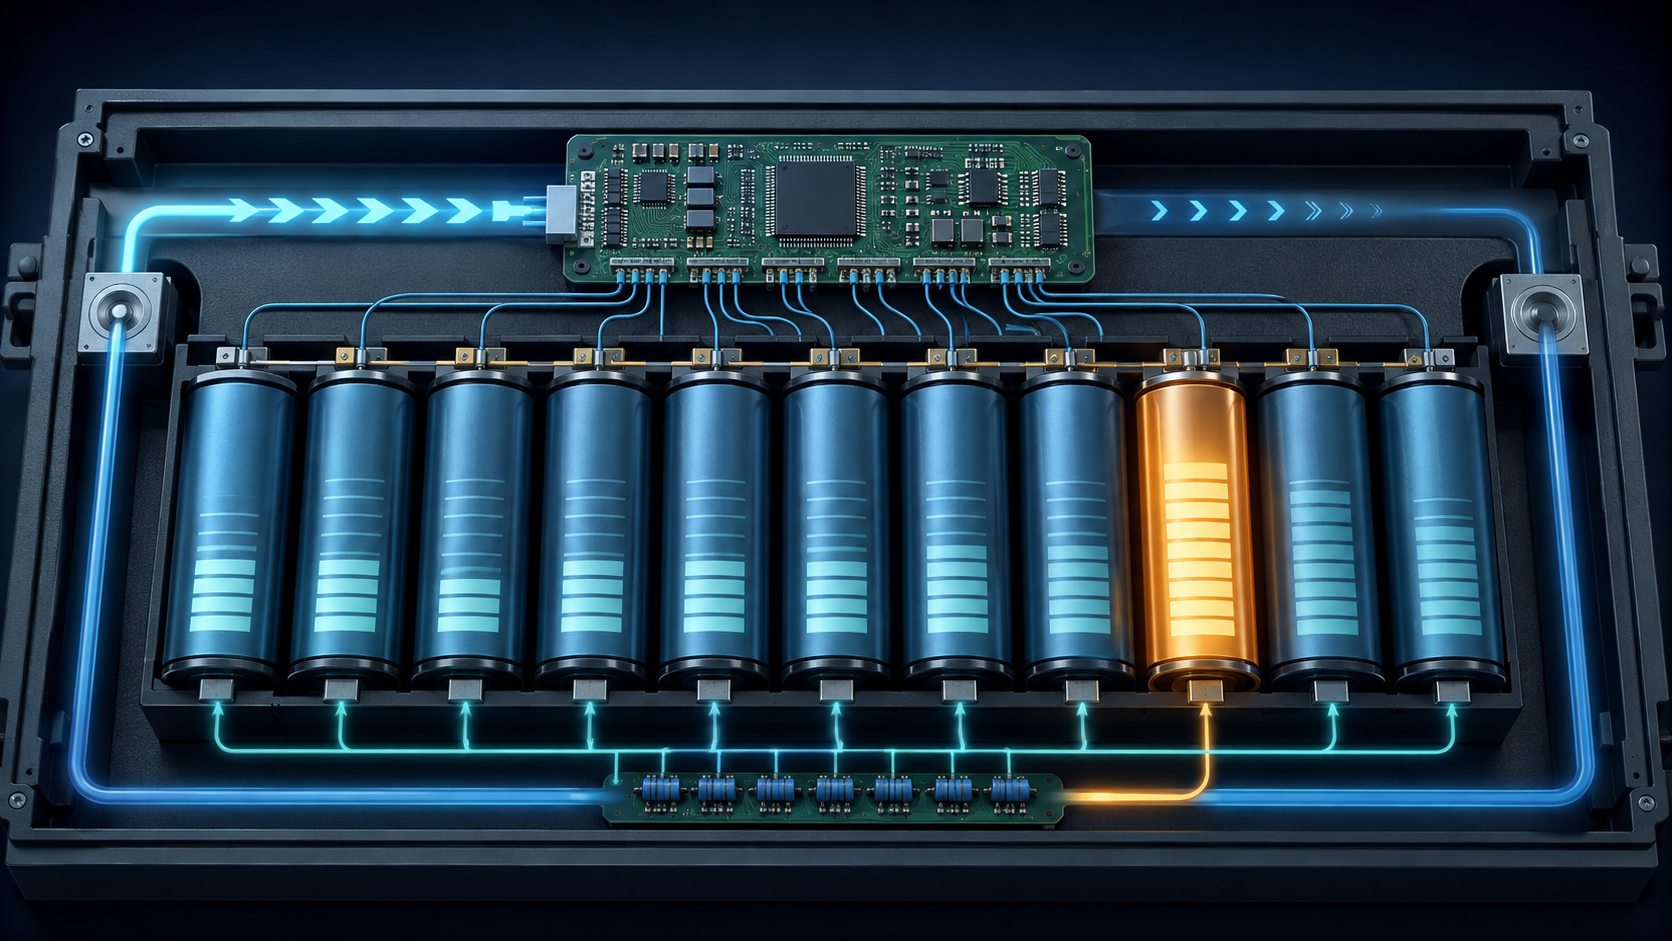
Cell balancing can explain a charging-power reduction near the top of the cycle. Small differences in capacity, resistance, temperature and aging can cause one cell to rise faster than the rest during charging.
When one cell approaches its upper voltage limit, the BMS may reduce the permitted charging current, request a lower charge voltage, pause charging temporarily, or allow charging again after the high cell voltage falls. Do not apply one supplier’s cell-voltage or balancing thresholds to another battery. The values are product-specific; the data fields are not.
| BMS value | Why it matters |
|---|---|
| Highest cell voltage | Shows whether one cell is reaching the upper boundary first |
| Lowest cell voltage | Helps calculate cell-voltage spread |
| Cell-voltage difference | Shows whether the pack is becoming less uniform |
| Charge Current Limit | Shows what current the BMS is allowing |
| Charge Voltage Limit | Shows whether the BMS is reducing the voltage target |
| Charge enable status | Shows whether charging is being paused by the BMS |
| Temperature spread | Helps separate thermal behavior from electrical imbalance |
If the BMS Charge Current Limit falls at the same moment as battery power, the battery is actively telling the inverter to reduce power. That is a control event, not merely a display problem.
Cause 4: household load and grid-import limits
Grid voltage is only one part of the AC-side diagnosis. A household battery may also be limited by the maximum permitted grid import.
Available battery charging power ≈ Import Power Limit − household load
Imagine a system configured with a 13kW import limit. This is a worked example, not a default value:
- Household load at 3kW: approximately 10kW remains for battery charging.
- Household load at 6.5kW: approximately 6.5kW remains for battery charging.
That produces the same visible 10kW-to-6.5kW change as the customer scenario without requiring a battery fault. The exact menu name and limit vary by inverter, main breaker, site wiring and local commissioning rules. Confirm whether battery charging is included and whether the limit is measured at the grid meter or calculated inside the inverter.
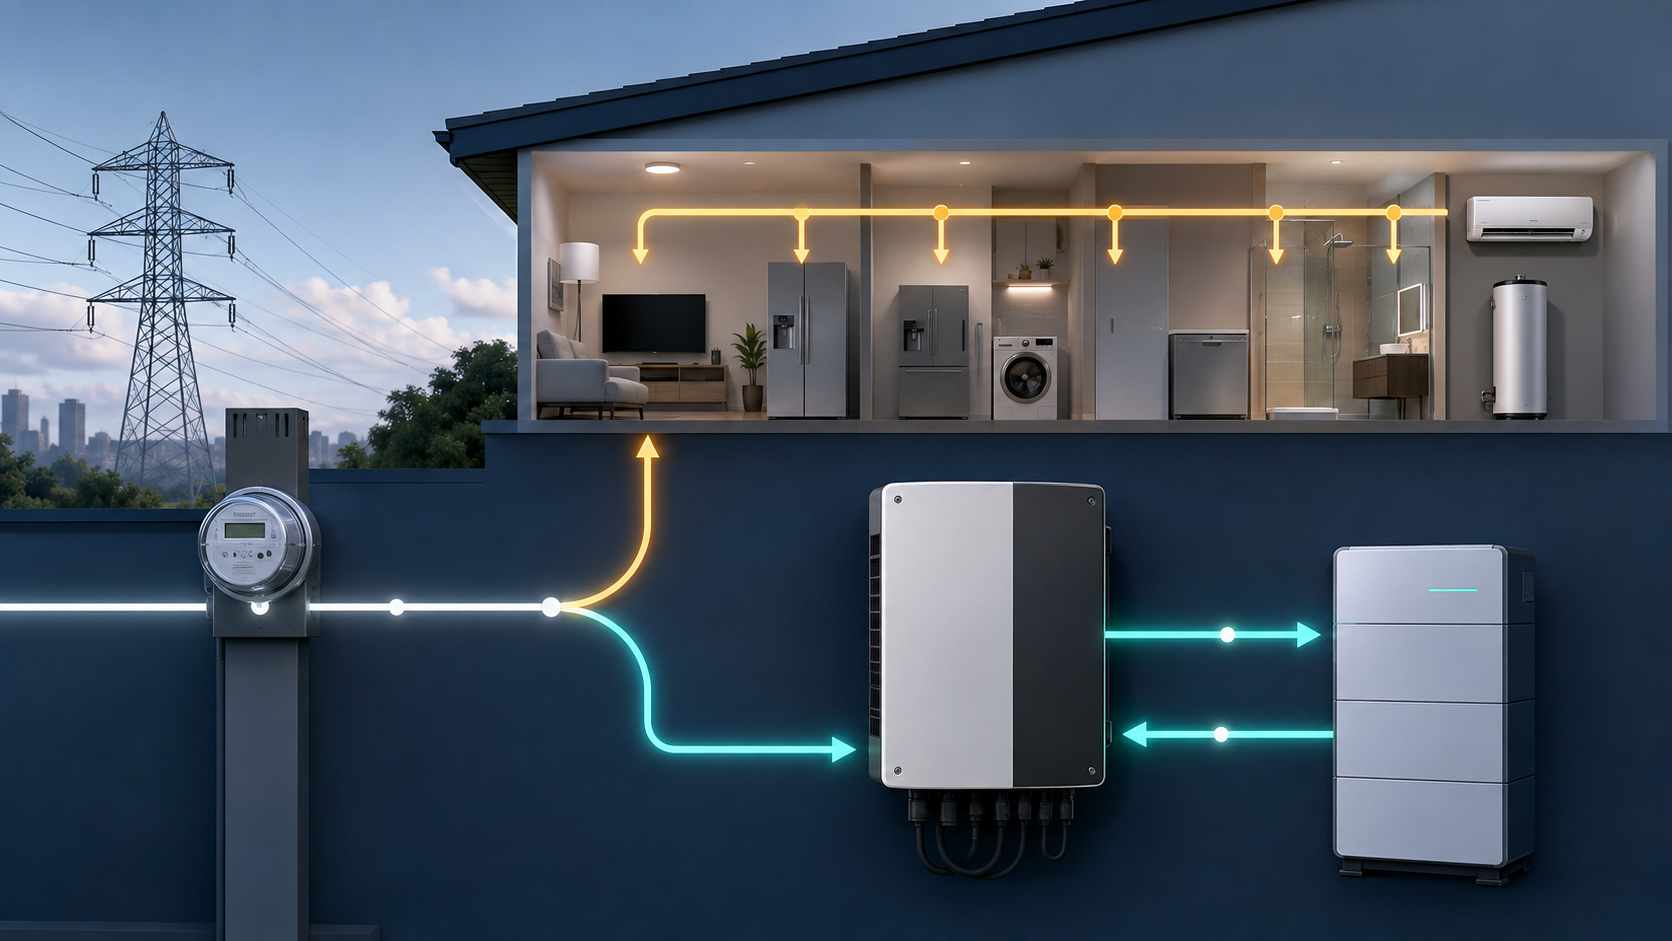
Look for settings such as Import Power Limit, Maximum AC Charging Power, Grid Charging Limit, Purchase Power Limit, Main Breaker Protection or Demand Control. At the same time, check whether a water heater, induction cooker, heat pump, pump or EV charger started when charging power fell.
Cause 5: grid voltage can matter, but do the math first
For a single-phase AC reference, real power can be approximated as:
P ≈ V × I × PF
At 230V and a power factor close to 1, 10kW requires about 43.5A and 6.5kW requires about 28.3A.
If current stayed constant, a drop from 10kW to 6.5kW would correspond to an effective voltage of roughly 150V. That is a very large change from a 230V nominal system. IEC 60038 lists 230V as a standard supply-voltage value, but the acceptable operating range depends on local rules and the inverter model.
A low or unstable voltage may cause an inverter to reduce current, enter a protection window or stop importing power. Check AC current, power factor, frequency, inverter alarms, phase-to-phase voltage on three-phase systems, Import Power Limit and household load together. Do not conclude “the grid caused the drop” from one low voltage screenshot.
Cause 6: communication and wiring can hide the real limit
In a closed-loop battery system, the BMS can send SOC, temperature, voltage and charge-current limits to the inverter. If the inverter reads only some of those values, the screen may show battery information without proving that dynamic BMS control is working.
The minimum useful data set normally includes Charge Voltage Limit, Charge Current Limit, Discharge Current Limit, temperature, SOC and alarm status. Confirm the CAN or RS485 register map and protocol version for the selected battery and inverter; a screen showing SOC alone does not prove that dynamic charge-current control is working.
- Correct CAN or RS485 protocol and cable pinout
- Correct battery address and baud rate or inverter battery profile
- Firmware compatibility and master/slave battery configuration
- Whether the inverter is actually following the BMS Charge Current Limit
DC wiring can create a separate problem. Cable loss follows approximately Ploss ≈ I²R: at 100A, even a 2V drop represents about 200W dissipated in the cable path. That calculation is an illustration, not a universal pass/fail limit. Measure voltage at both ends of the cable while the battery is charging; a charger may report its own terminal voltage while the battery sees less.
A practical diagnostic sequence for a 20-minute power drop
Use the following order. It avoids changing settings before the system has produced useful evidence.
- Reproduce the event. Record the charging start time and the exact time when power falls. Repeat the test with the same charging source if possible.
- Confirm the measurement side. Note whether each value comes from the grid meter, inverter AC input, inverter DC output, battery BMS or cloud application.
- Capture the values before and after the drop.
| Time | SOC | AC input power | DC battery power | Household load | AC voltage | Battery temp. | Inverter temp. | Cell spread | BMS CCL |
|---|---|---|---|---|---|---|---|---|---|
| Start | |||||||||
| 10 min | |||||||||
| 20 min | |||||||||
| After drop |
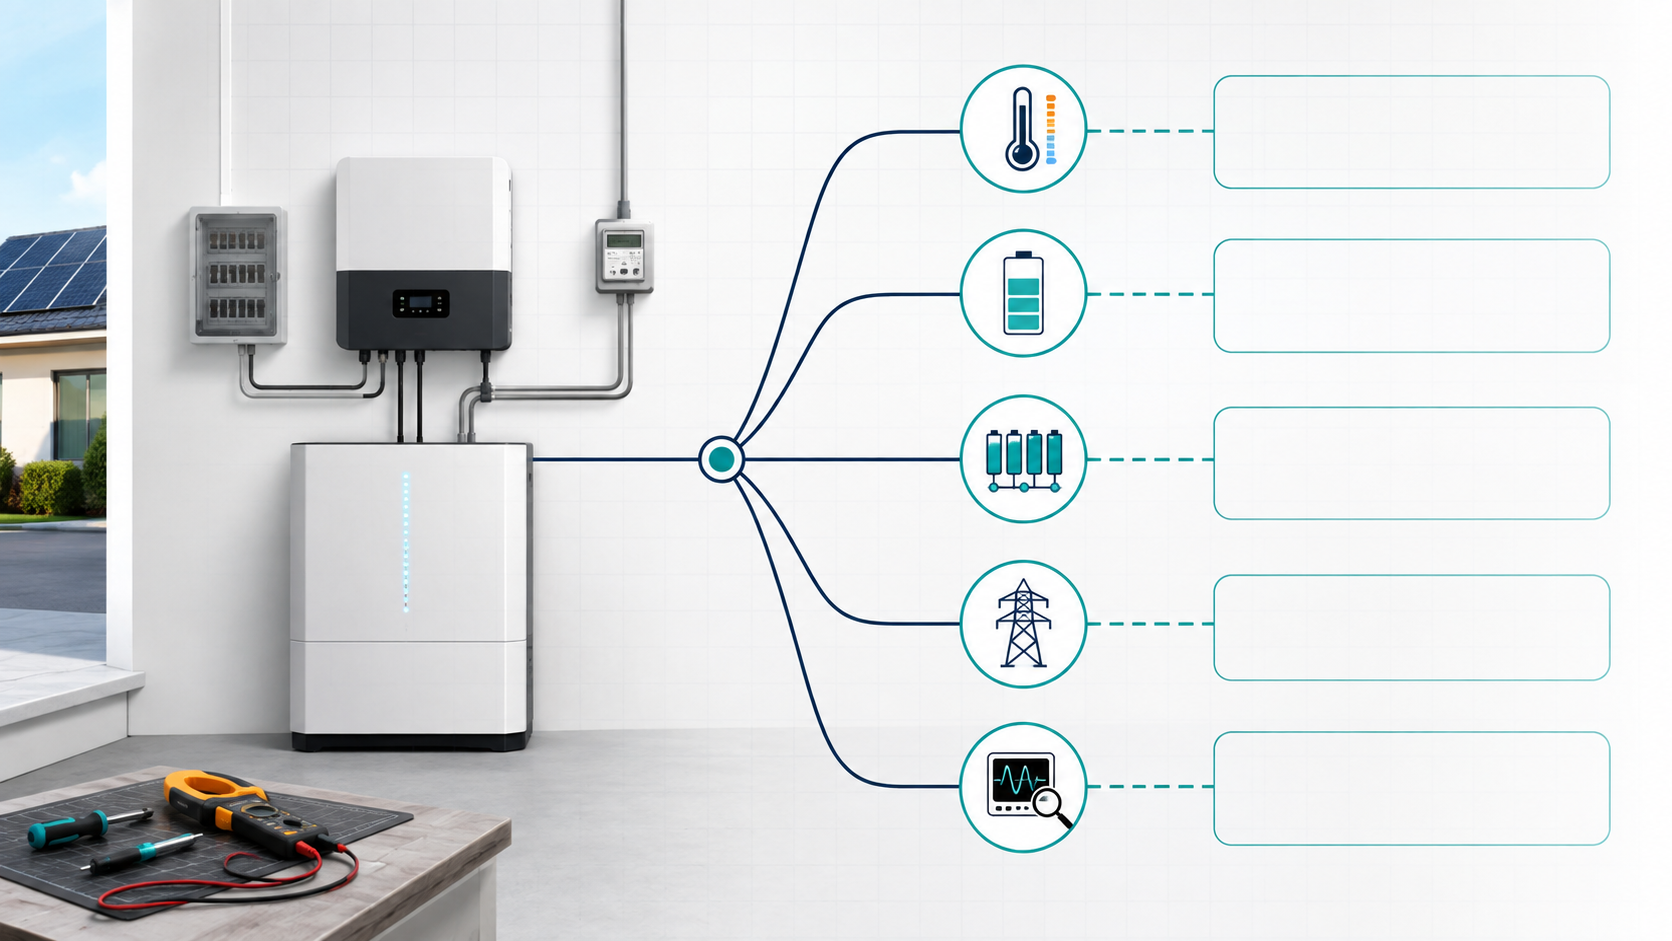
| Observed pattern | More likely explanation |
|---|---|
| SOC is near the upper range and power tapers smoothly | CC-CV charging or normal top-of-charge control |
| One cell rises quickly and CCL falls | Cell imbalance or BMS protection limit |
| Battery or inverter temperature rises before the drop | Thermal power derating |
| Household load rises as battery charging falls | Import Power Limit or demand control |
| AC voltage or frequency leaves the inverter window | Grid protection or input-current reduction |
| App changes but local meters remain stable | Monitoring sample or display issue |
| Power cycles on and off every few minutes | BMS protection, communication issue or inverter control loop |
Only then change settings. Do not raise charge voltage, disable BMS protection or increase the current limit simply to recover the original power. A setting that hides the symptom can create a cell-overvoltage or thermal problem.
What distributors and installers should request before buying
The nameplate maximum charge power is not enough for a serious system comparison. Ask the supplier for:
- Maximum continuous charge power and current
- Charge-power behavior across the SOC range
- Charging temperature range and temperature warning, derating and shutdown thresholds
- BMS Charge Current Limit and Charge Voltage Limit behavior
- Cell-voltage and temperature visibility
- CAN/RS485 protocol and inverter compatibility list
- AC charging power limit and grid-import control behavior
- Inverter thermal derating data
- Cable and terminal requirements
- Event logs that can be exported for troubleshooting
For a distributor, this information reduces product-selection, commissioning, warranty-review and customer-support risk at the same time. For a compatibility review, see CVC’s energy storage battery options and inverter solutions.
CVC can help match the battery to the system
If the battery, inverter and BMS are sourced separately, a charging-power complaint can become a responsibility dispute. The battery supplier blames the inverter. The inverter supplier points to the grid. The installer has no usable log.
CVC can help review the battery voltage, capacity, inverter model, charging power, communication interface and project country before a product is selected. The goal is to identify the correct battery source and confirm the information needed for commissioning. For project requests, use the CVC contact page or the form below.
FAQ
Why does battery charging power drop after 20 minutes?
The most common possibilities are temperature-related power derating, a transition into the CC-CV charging stage, a falling BMS Charge Current Limit, higher household load or an inverter grid-import limit. The timing alone does not identify the cause.
Is it normal for charging power to fall near 90% or 100% SOC?
Often, yes. Many lithium systems reduce current as they approach the charge-voltage limit. If the power falls at a lower SOC, or if the battery shows abnormal cell-voltage spread or alarms, collect BMS data before calling it normal.
Can cell balancing reduce charging power?
Yes. If one cell reaches its upper voltage boundary before the others, the BMS may lower the allowed current or cycle the charger on and off. The exact voltage and current thresholds depend on the battery design.
How can I tell whether the inverter or battery is causing power derating?
Compare the inverter output limit with the BMS Charge Current Limit and battery temperature. If the BMS limit falls first, the battery is requesting lower power. If the BMS limit remains high while inverter temperature or AC input conditions change, investigate the inverter and grid side.
Can low grid voltage reduce battery charging power?
Yes, if the voltage moves outside the inverter’s operating window or causes the inverter to reduce input current. But a modest voltage change usually does not explain a large power drop by itself. Check voltage, current, frequency, power factor and inverter alarms together.

Peter Yin
Send a Project Inquiry
Share your battery voltage, inverter model, initial and reduced charging power, SOC and temperature readings.